For years, the US Federal Reserve has pumped trillions of dollars into the economy to support the increasing national debt without raising interest rates. The Fed justified this action with the claim that the increased money supply has minimally affected the inflation rate as reported by changes in the Consumer Price Index (CPI).
According to the Bureau of Labor Statistics (BLS), inflation has been relatively low for the past 20 years.
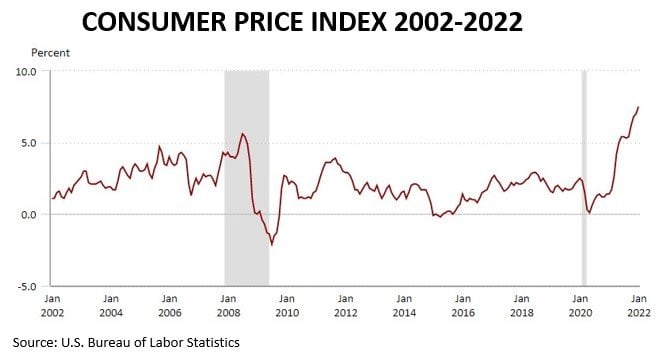
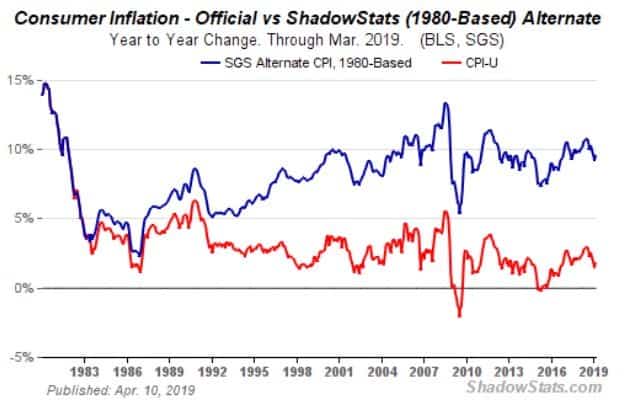
At best, the conclusion is misleading since the BLS from time to time reconfigures the CPI to what many analysts write is the government’s way of avoiding “overstating the inflation rate,” somewhat akin to changing the rules in the middle of the game.
The proof is not hard to find. If the BLS used its own 1980 formulation, the inflation figure would be significantly higher over the past 30 years:
What is asset inflation and what causes it?
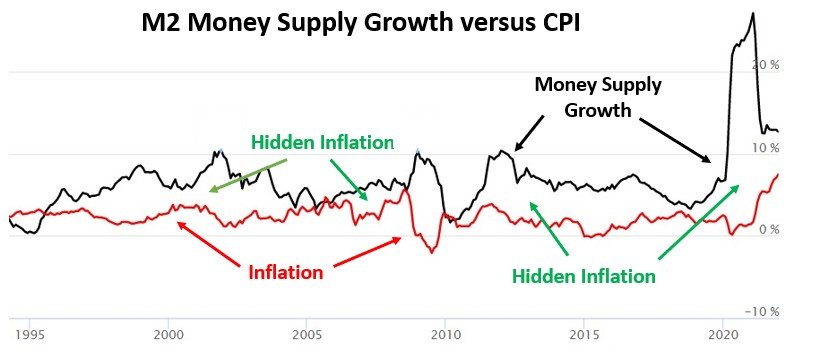
Inflation is a money supply phenomenon. It is the result whenever the money supply grows faster than productivity. The following chart illustrates the growth in the money supply (M2) versus CPI-reported inflation. The difference between the two lines is “hidden inflation.” That difference is reflected in the overvaluation of assets.
Real economic growth is always tied to increased productivity, not simply financial transactions. Buying a company’s securities does not add to its production. Even if the stock price goes up, no tangible economic goods are directly produced.
Unfortunately, many misinterpret rising asset prices as a sign of a growing economy instead of a change in investor sentiment driven by emotions or previous performance.
Asset inflation is usually present when the values of most assets increase relative to the purchasing power of the currency. When most assets are rising, the cause is more than likely the Fed increasing the money supply and the money ending up in the asset markets.
The amount of money flowing into the equities market in the past two years is larger than in the previous 19 years combined, and it has boosted asset values to unsustainable levels.
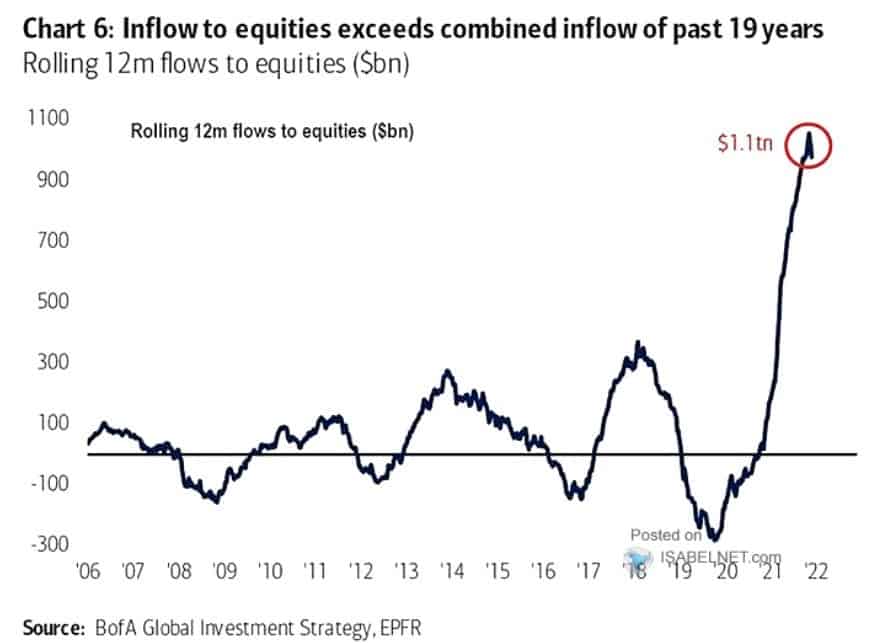
The bursting of the equities bubble
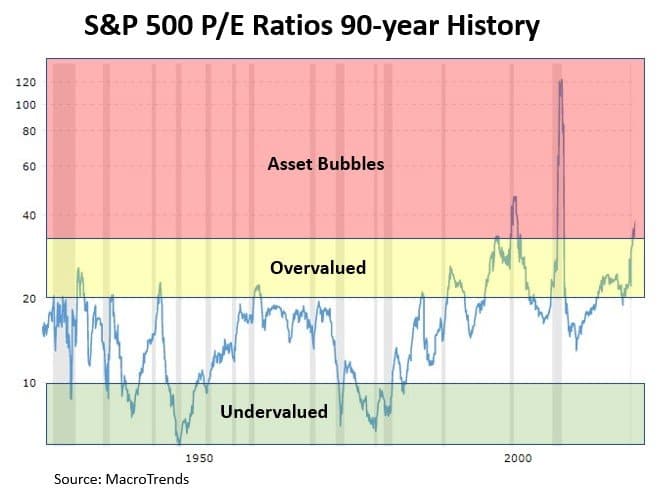
The Fed-induced excess inflation appeared first in asset prices, then consumer prices. The years of holding interest rates too low for too long have pumped trillions of dollars into assets, creating a massive asset bubble that, according to Lance Roberts, will ultimately burst and “throw the U.S. and global economy into another depression.”
And this bubble is a massive one. Since 2019 and the Fed’s rapid increase in its borrowing and the money supply, corporate valuation multiples have more than doubled.
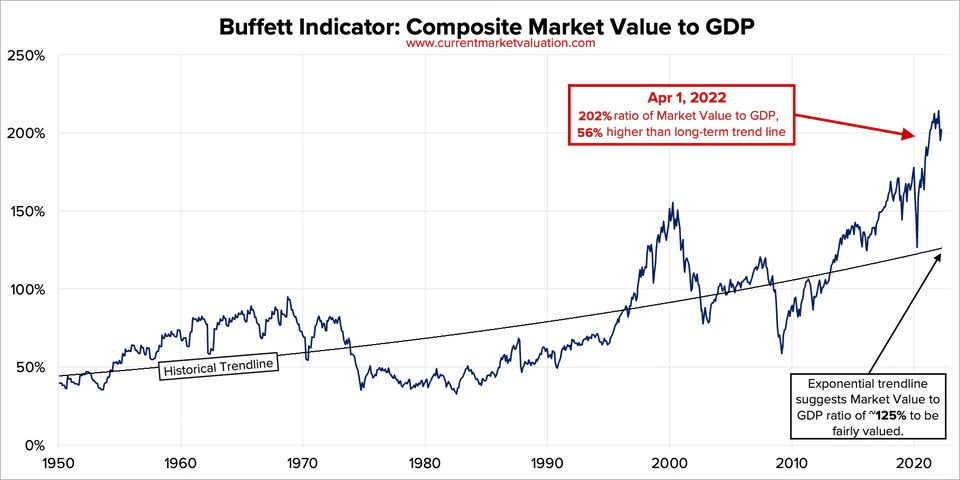
Similarly, the ratio of total market value (Wilshire 5000 Index) to GDP is over 2:1.
Equities inflation versus gold
Unlike fiat currencies, such as the US dollar, the global supply of gold is relatively fixed. Gold cannot be printed, and its stability and universal acceptance for more than 5,000 years are unique among assets and currencies.
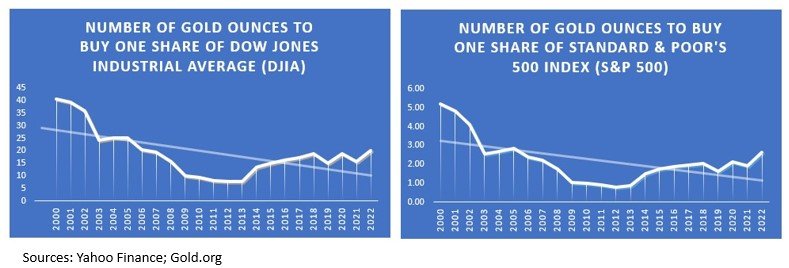
Determining real growth in the value of an asset using constantly depreciating dollars leads to inflated values. For example, a share of the S&P 500 on January 1, 2000, was $1,469.25; on the same date in 2022, its value was $4,778.14.
At first glance, it appears that the purchaser of a share of the S&P 500 in 2000 would have tripled that investment today. But if you use an ounce of gold as the exchange value, the results are significantly different. With the increase in the stock price, you might assume that you would need more ounces to buy the share. However, the number of gold ounces almost halves the number required in 2000.
For example, one share of the S&P 500 ($1469.25) was worth 5.21 ounces of gold ($282.05 per ounce) on January 1, 2000. By 2022, one share of the S&P 500 valued at $4,778.14 was the equivalent of 2.64 ounces at $1,811.40 per ounce. In other words, the value of gold has gained relative to the S&P 500. The exact same relationship exists with the Dow Jones Industrial Average (DJIA).
Real estate inflation versus gold
Many advisors recommend home ownership as a defense against inflation. Unfortunately, houses and other real estate are also subject to asset inflation. According to the Census Bureau, the median price per sq. ft. of a home increased from $70.43 in 2000 to $122.12 in 2020. A typical American single-family home of 2,057 sq. ft. cost $144,875 in 2000. A house that same size would cost $251,201 in 2020, 73.3% higher.
If the purchaser used gold as the exchange value, the house that required 514 ounces ($144,875/$282.05) in 2000 would sell for just 139 ounces in 2020 ($251,201/$1,811.40).
The value of diversification
Will the asset bubbles in equities and real estate burst? History suggests there is always a reckoning when fundamental values get out of whack. Diversifying your savings with physical gold can help reduce your overall market risk without sharply cutting your potential market and real estate gains.
Since 2000, gold has experienced an average annual growth of 27%, considerably more than the S&P 500 (9.9%) or the DJIA (9.16%), so owning gold could even grow your savings if that trend continues. Owning gold as part of a balanced portfolio makes strategic sense.
The post How to Spot Hidden Asset Inflation and Reduce Risk appeared first on Gold Alliance.

